![]()
Optimisez les performances
de votre réseau avec PRTG

Contrôlez les performances de l'ensemble de votre réseau
Identifiez les goulots d'étranglement
Soyez averti immédiatement en cas de baisse de performances
Modernisez votre réseau pour satisfaire les besoins propres à votre entreprise
Les performances de réseau avec PRTG
Aller au sujet de votre choix
- Pourquoi les performances de réseau comptent-elles tant ?
- PRTG est un outil central de supervision des performances réseau
- Surveillez les performances de l'ensemble de votre réseau
- Soyez le premier informé des problèmes de performances de réseau
- Contrôlez les performances de réseau à l’aide de capteurs prédéfinis ou personnalisés
- Comparatif entre WMI, SNMP, reniflage de paquets et NetFlow
- Test des performances réseau / Test Ethernet
- Vous souhaitez en savoir plus ? Jetez un œil ici !
Pourquoi les performances de réseau comptent-elles tant ?
![]()
L’objectif : un réseau disponible 100 % du temps
Lors de la configuration de votre dispositif de surveillance, un de vos objectifs premiers sera de faire en sorte que votre réseau soit opérationnel au maximum, si possible 100 % du temps. Pour autant, une disponibilité parfaite n’est pas une fin en soi, et vous serez bien désarmé si votre réseau affiche de piètres performances. Outre la frustration qu’ils engendrent chez les employés de l’entreprise, les soucis de performances comme le manque de bande passante, la saturation des serveurs ou le manque de réactivité des machines virtuelles peuvent paralyser les processus de travail et provoquer une baisse du volume des ventes.
Quand le réseau offre des performances de qualité, c’est toute l’entreprise qui travaille avec une efficacité maximale. L’outil de supervision des performances qu’est PRTG vous permet de prévenir la formation des goulots d’étranglement qui dégradent les performances, mais aussi de veiller à ce que tous les ordinateurs, serveurs et logiciels fonctionnent au mieux.
Optimisez la planification des ressources
![]()
Planification de l'infrastructure informatique
PRTG vous offre une visibilité continue sur les niveaux de performances de chacun des composants de votre réseau. Cette vue d’ensemble est particulièrement précieuse à l’heure d’organiser votre infrastructure informatique. Elle vous permettra notamment d’étendre votre salle de serveurs de manière à minimiser les dépenses engagées par l’entreprise. Avec un peu de chance, vous pourrez même réaliser des économies en optimisant la gestion de certains des autres composants réseau.
PRTG est un outil central de supervision des performances réseau
![]()
Tous les indicateurs de performances présentés de façon intelligible
Les performances jouent un rôle prépondérant dans les diverses couches qui composent une infrastructure informatique. Or, la supervision manuelle des composants réseau, applications et services s’avère peu efficace, a fortiori si le réseau s’est déjà étendu au-delà du raisonnable.
PRTG recueille toutes les données reflétant les performances du réseau et les affiche sur des tableaux de bord conçus pour faciliter au maximum leur interprétation. Vous pouvez modifier à votre convenance la façon dont ces données sont affichées, mais aussi utiliser les cartes sur mesure de PRTG pour créer des tableaux de bord qui collent parfaitement à vos besoins.
Grâce à PRTG, superviser les performances de réseau devient un jeu d’enfant !
Gardez en permanence un œil sur votre réseau – même lors de vos déplacements
Configurez PRTG en quelques minutes et utilisez-le sur presque tous les appareils mobiles.


Surveillez les performances de l'ensemble de votre réseau
![]() La bande passante désigne le volume de données qui peut être transféré d’un point à un autre d’un réseau en un laps de temps défini. Généralement, elle s’exprime sous la forme d’un débit binaire, ou bitrate, mesuré en bits par seconde (bps). Ce chiffre correspond à la capacité de transmission d’une connexion et influe considérablement sur la qualité et la vitesse d’un réseau.
La bande passante désigne le volume de données qui peut être transféré d’un point à un autre d’un réseau en un laps de temps défini. Généralement, elle s’exprime sous la forme d’un débit binaire, ou bitrate, mesuré en bits par seconde (bps). Ce chiffre correspond à la capacité de transmission d’une connexion et influe considérablement sur la qualité et la vitesse d’un réseau.
En savoir plus
![]()
Bande passante
La bande passante est une variable qu’il faut impérativement prendre en ligne de compte quand on s’attèle à mesurer les performances d’un réseau. PRTG affiche en temps réel des données comme la vitesse de téléchargement et d’upload. Il indique également la vitesse des connexions locales. Vous pouvez observer le trafic de données directement depuis votre routeur afin de consulter facilement et rapidement votre consommation de bande passante, ainsi que le volume de données transmises correspondant.
Bien des dysfonctionnements qui affectent les réseaux sont dus à un manque de bande passante. Quand les applications tournent au ralenti, quand les sauvegardes automatiques s’interrompent en cours de route ou quand il faut une éternité pour acheminer des données d’un point à l’autre, c’est souvent l’insuffisance du débit qui est en cause. PRTG surveille la bande passante et vous tient constamment informé de ce qui se passe sur votre réseau. Cela vous permet de déterminer précisément la consommation de bande passante de vos services et de vos appareils et de suivre son évolution au fil du temps. Fort de ces informations, vous pouvez rapidement aller à la racine des problèmes, éliminer les éléments qui accaparent la bande passante, ou mettre à niveau le réseau là où cela s’avère nécessaire.
Pour en savoir plus sur la gestion de la bande passante, veuillez cliquer ici.
![]()
Machines virtuelles
La virtualisation joue un rôle important dans le fonctionnement de l’infrastructure informatique de beaucoup d’entreprises. Elle permet non seulement d’optimiser l’usage des ressources, mais aussi de répartir les capacités de façon dynamique, tout en réduisant la fréquence des opérations de maintenance réseau. Pour profiter de ces avantages, il faut néanmoins que tous les éléments virtualisés tournent à plein. PRTG scrute les performances de votre infrastructure virtualisée à plusieurs niveaux. Ses tableaux de bord parfaitement organisés affichent toutes les données qu’il vous faut pour avoir une idée précise de l’état de vos serveurs hôtes et machines virtuelles, mais aussi des systèmes d’exploitation et des applications qui y sont hébergés.
Si les performances de vos machines virtuelles s’avèrent insuffisantes, PRTG vous en alertera afin que vous preniez les mesures nécessaires sans perdre une seconde. PRTG est compatible avec les logiciels de virtualisation les plus répandus, dont VMware, Citrix et HyperV.
![]()
Performances des applications
Quantité d’applications sont compatibles avec les ordinateurs et les serveurs de n’importe quel environnement informatique. Celles-ci doivent offrir des performances irréprochables, a fortiori si le fonctionnement des activités essentielles à l’entreprise en dépend directement. Nous vous déconseillons de les superviser de façon artisanale, car vous pourriez rapidement perdre de vue les valeurs les plus importantes.
PRTG surveille automatiquement les performances de réseau de l’ensemble de vos processus et de vos applications et agrège les données sur un tableau de bord conçu pour faciliter au maximum leur interprétation. Ainsi, il suffit d’un coup d’œil pour voir quelles applications sollicitent quelles ressources, et comment le trafic est disséminé. PRTG vous informe immédiatement, c'est-à-dire avant que les problèmes découlant d’un manque de capacités se matérialisent, ce qui vous permet d’intervenir rapidement et d’éviter les pannes réseau.
Pour en savoir plus sur la surveillance des applications, veuillez cliquer ici.
![]()
Performances des serveurs
Au fil de l’expansion de votre entreprise, vos processeurs sont de plus en plus sollicités. Et pour cause : les utilisateurs sont de plus en plus nombreux à accéder aux applications, aux fichiers et aux autres contenus hébergés sur vos serveurs. Les logiciels et les services tournent un peu moins vite, et les performances de l’ensemble en prennent un coup. Grâce à PRTG, vous pouvez immédiatement détecter les goulots d’étranglement et voir si vos serveurs sont proches de la surcharge.
PRTG vous avertit à temps pour que vous évitiez une saturation des serveurs qui condamnerait vos collègues au chômage technique. Il vous aide à optimiser le fonctionnement de votre salle des serveurs en déterminant les éléments qui doivent être mis à niveau et ceux sur lesquels vous pouvez économiser des ressources.
![]()
Compteurs de performances de Windows
À travers ses compteurs de performances, Microsoft Windows a créé un service qui mesure les performances des applications logicielles. Le moniteur de performances proposé par défaut sous Windows (perfmon.exe) présente les données glanées par les compteurs de performances sous forme de graphiques, mais ne permet pas aux utilisateurs de personnaliser ou de réorganiser leur affichage pour les interpréter plus facilement. En outre, le moniteur de performances de Windows ne comporte pas de système d’alarme.
PRTG comble ces lacunes en vous permettant de consulter tous les compteurs de performances de vos systèmes Windows et en affichant les données correspondantes sur un tableau de bord qui permet de les décrypter aisément. Vous pourrez ainsi observer l’évolution des indicateurs de performances, et déterminer en un rien de temps l’origine des goulots d’étranglement (et leur cause). Une fois que vous aurez défini les limites de votre choix pour chacun des compteurs, vous serez immédiatement averti si elles sont dépassées.
PRTG a aussi l’avantage de générer automatiquement des rapports sur les périodes écoulées, une solution idéale pour tenir vos collègues ou supérieurs informés des performances de votre réseau.
Pour en savoir plus sur les compteurs de performances de Windows, veuillez cliquer ici.

« L’assistance fournie par Paessler AG nous a grandement rassurés. Tous les services auxquels nous avons eu affaire ont brillé par leur réactivité, leur savoir-faire et les solutions proposées pour régler leurs problèmes. »
Andreas Reimann, Concepteur de réseaux de communication à l'aéroport de Zürich. L'aéroport de Zürich utilise plus de 4 500 capteurs à des fins de surveillance réseau
Plébiscité par 500 000 utilisateurs et reconnu comme une référence par les experts du secteur

« Une solution de supervision des réseaux et infrastructures qui s’installe aisément et s’utilise encore plus facilement. La meilleure du marché, sans conteste. »

« Un logiciel absolument parfait, doublé d’une assistance technique de premier ordre. Par sa capacité à se plier à tous les besoins et contraintes, c’est un outil indispensable pour qui veut superviser tout ou partie de son réseau. »

« Un outil qui remplit magistralement sa mission première : offrir un service unifié de gestion des infrastructures et de supervision réseau et informatique. »

« En résumé, en matière de supervision sur site, PRTG Network Monitor est difficile à battre. Il propose une gamme impressionnante de capteurs pour les périphériques locaux et les services en nuage, ainsi que de nombreuses options de supervision, tout en étant facile à gérer et doté d'un système de tarification simple et abordable, idéal pour les PME. »
Soyez le premier informé des problèmes de performances de réseau
![]() Qu'est-ce qu'un capteur en PRTG ?
Qu'est-ce qu'un capteur en PRTG ?
Les «capteurs» sont les éléments de supervision de base de PRTG. Un capteur surveille généralement une valeur mesurée dans votre réseau, par exemple le trafic d'un port de commutateur, la charge du processeur d'un serveur, l'espace libre d'un lecteur de disque. Vous devez compter en moyenne de 5 à 10 capteurs par appareil ou d'un capteur par port de commutateur.
![]()
PRTG vous avertit au moindre signe de baisse de performances
Sachant que les problèmes de performances peuvent perturber le fonctionnement des activités quotidiennes de votre entreprise, il est vital que vous puissiez intervenir dès leur survenance. Grâce au système d’alarme de PRTG, vous avez l’assurance d’être prévenu immédiatement en cas d’apparition de goulots d’étranglement ou de baisses de performances. En règle générale, vous serez en mesure de résoudre le problème avant que vos collègues ou clients ne s’avisent de quoi que ce soit… ce qui devrait vous valoir toute la gratitude de votre patron !
![]()
Personnalisez vos capteurs
Vous pouvez appliquer à chaque capteur les valeurs seuils que vous désirez. Si elles sont dépassées, vous recevrez immédiatement une alerte sur le support qui vous sied le mieux : email, SMS, ou notification Push sur votre application.
![]()
Analyse des performances réseau
Utilisez PRTG pour superviser et analyser vos performances réseau sur des périodes prolongées. La supervision au long cours vous aide à localiser la cause des problèmes survenant à certains moments de la journée ou du mois, ce qui vous permet d’améliorer les performances de votre réseau !
Contrôlez les performances de réseau à l’aide de capteurs prédéfinis ou personnalisés
PRTG est équipé de capteurs préconfigurés pour la supervision de plusieurs indicateurs de performances de votre réseau.
Découvrez tout l’arsenal de capteurs de PRTG dans notre catalogue de capteurs. Parmi ceux-ci :
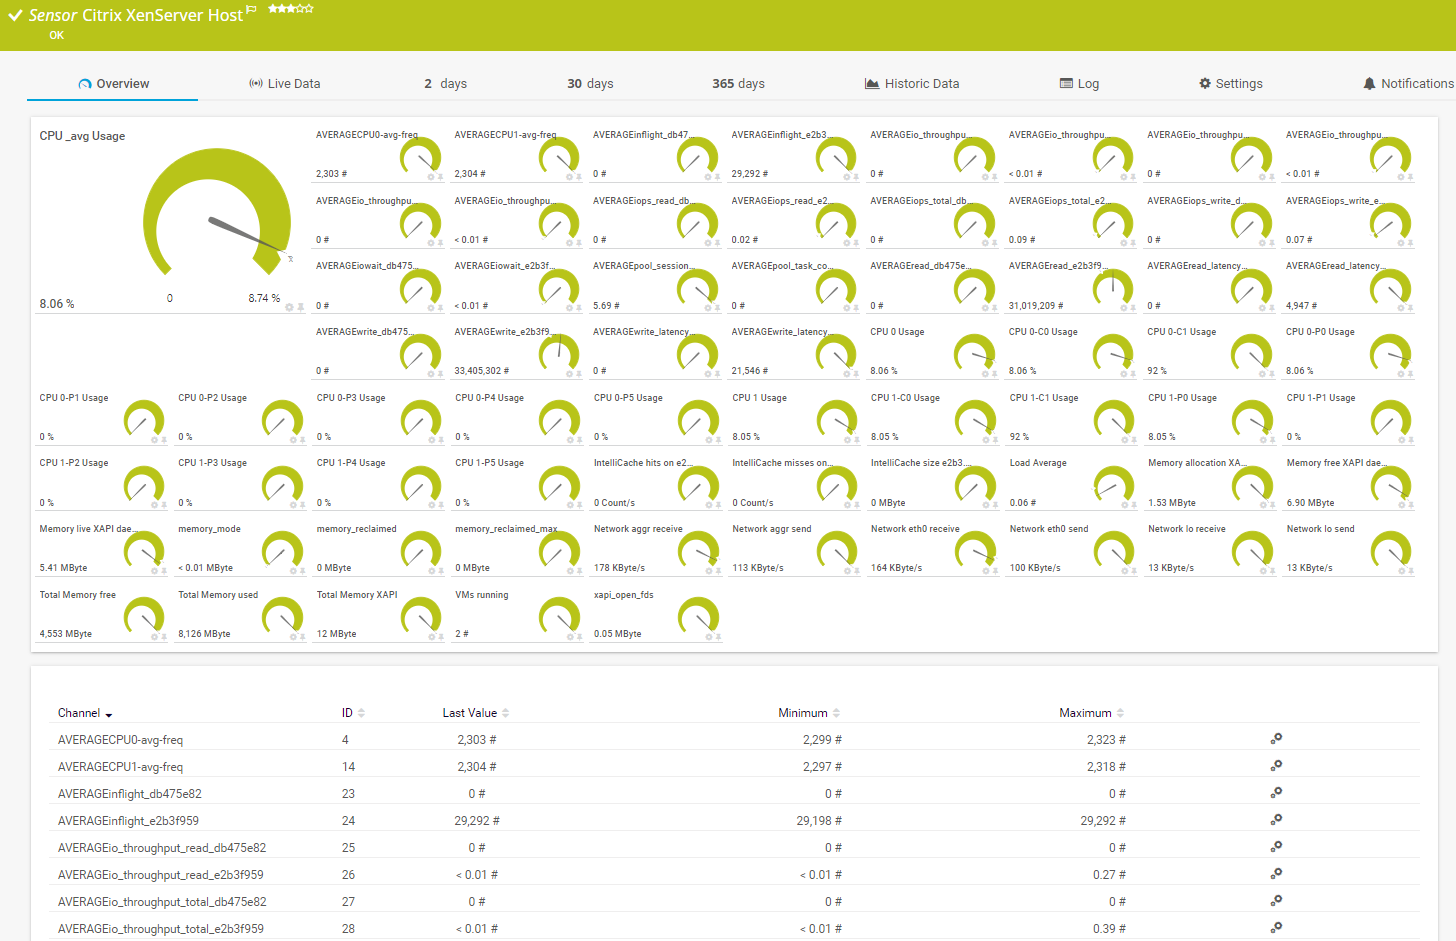
Capteur de Citrix XenServer serveur hôte
Le capteur de Citrix XenServer serveur hôte vous permet de superviser le serveur hôte de votre environnement de virtualisation Citrix. Ce faisant, vous garderez en permanence un œil sur les indicateurs de performances comme la charge CPU, la capacité de la mémoire et l’utilisation du réseau.
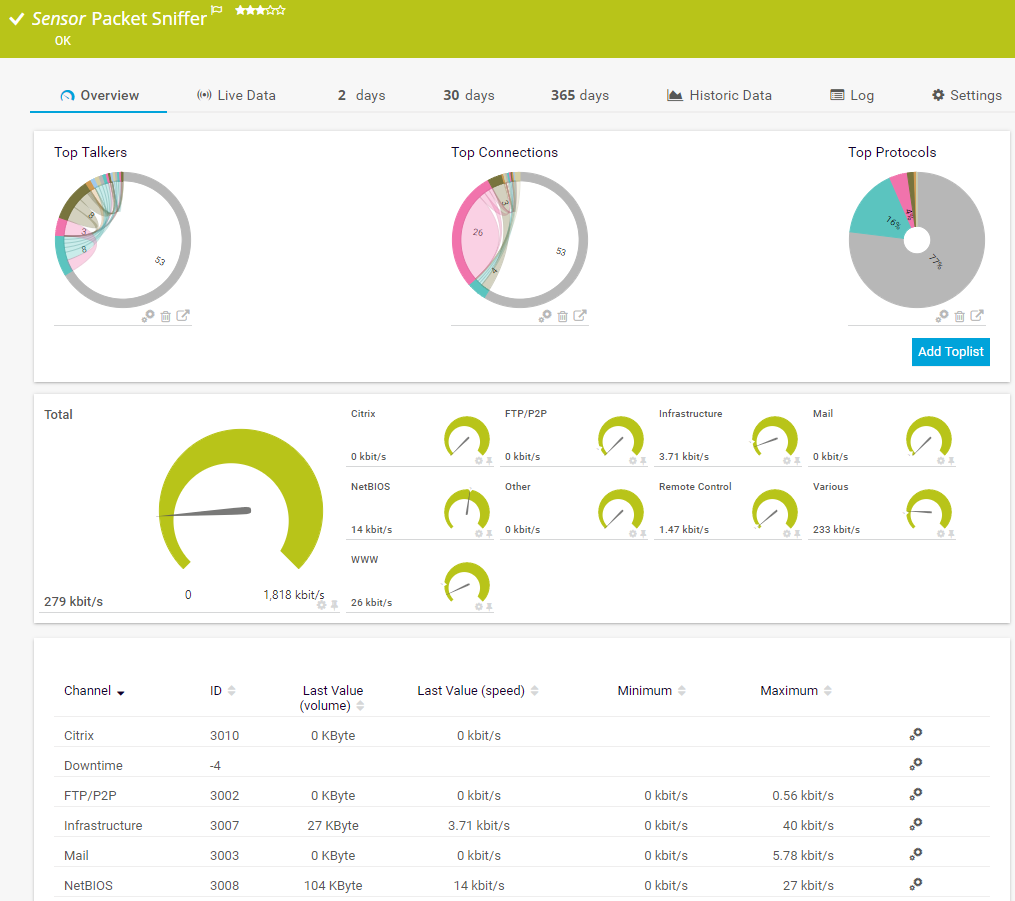
Capteur de Reniflage de paquets
Le capteur de Reniflage de paquets analyse les en-têtes de tous les paquets de données de votre réseau et détermine la quantité de trafic générée par chacun des services en cours d’exécution.
En savoir plus sur le reniflage de paquets.
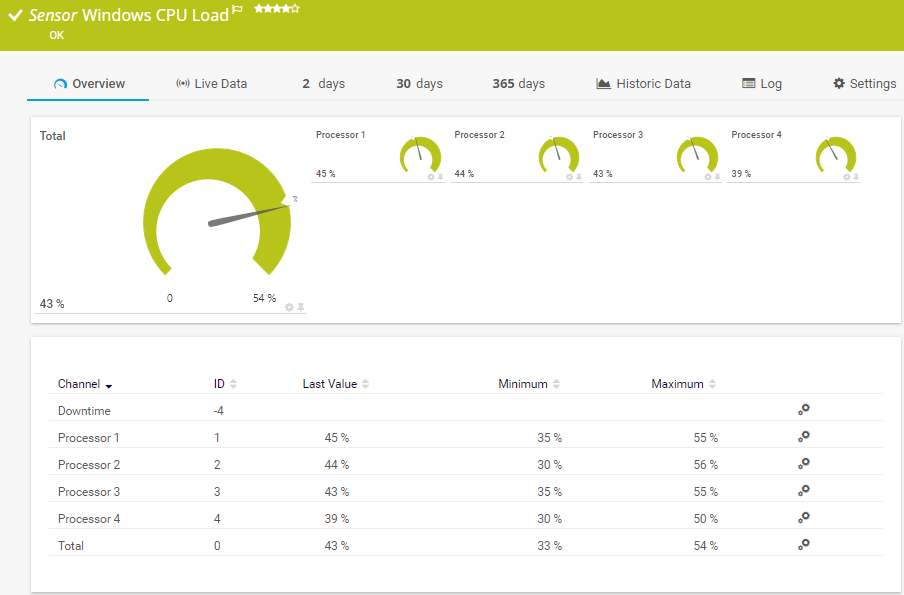
Capteur de Charge CPU de Windows
Le capteur de Charge CPU de Windows utilise la technologie WMI ou les compteurs de performances de Windows pour mesurer la charge CPU d’un ordinateur.
Vous pouvez également coder vos propres capteurs et les intégrer à PRTG.
PRTG facilite votre travail
Notre logiciel de supervision vous permet de vous concentrer sur vos tâches en vous alertant immédiatement en cas de problème.
![]()
Économisez des efforts
PRTG vous permet d'avoir un outil de supervision centralisé pour tous les serveurs et pour l'ensemble de votre réseau. Profitez d'un aperçu rapide de l'ensemble de votre infrastructure grâce à notre tableau de bord et à notre application.
![]()
Gagnez du temps
Démarrer avec PRTG est un jeu d'enfant. La configuration ou le transfert d'un autre outil de supervision réseau est facile grâce à la découverte automatique et aux modèles d'équipements préconfigurés.
![]()
Économisez de l'argent
80 % de nos utilisateurs nous font part d'économies de coûts subtantielles avec la supervision réseau.. Les frais de licence sont amortis en quelques semaines.
Supervision des performances : comparatif entre WMI, SNMP, reniflage de paquets et NetFlow
Quelle méthode souhaitez-vous adopter pour la supervision de votre bande passante ? Outre la technologie WMI, PRTG permet de le faire via
SNMP, reniflage de paquets, de NetFlow et IPFIX. Chacune de ces options a ses avantages et ses inconvénients. En voici une présentation succincte :
|
| WMI | SNMP | Reniflage de paquets | Flow (IPFIX, NetFlow, sFlow, jFlow) |
|---|---|---|---|---|
| Configuration | Intermédiaire | Facile | Facile à difficile | Parfois complexe (par exemple, si le commutateur doit être paramétré) |
| Filtrer le trafic |
|
|
|
|
| Différencier la consommation de bande passante par protocole ou adresses IP |
|
|
|
|
| PRTG peut afficher des Top Listes (Top Talkers, Top Connexions, Top Protocoles, liste personnalisable) |
|
|
|
|
| Filtrer la consommation de bande passante par IP |
|
|
|
|
| Filtrer la consommation de bande passante par adresse MAC |
|
|
|
|
| Filtrer la consommation de bande passante par port réseau physique |
|
|
|
|
| Surveiller d’autres paramètres réseau que la consommation de bande passante |
|
|
|
|
| Charge CPU de la machine exécutant PRTG | Intermédiaire | Basse | Plus élevée, varie selon la quantité de trafic | Plus élevée, varie selon la quantité de trafic |
| Surcroît de consommation de bande passante pour la supervision | Léger | Léger | Aucun (sauf quand la supervision sollicite les ports du commutateur) | Varie selon la quantité de trafic |
Test des performances réseau / Test Ethernet
Test des performances réseau
Le capteur Ping v2 de PRTG est l’outil idéal pour jauger les performances de votre réseau. Ce capteur contrôle la disponibilité de chacun de vos appareils réseau. Durant l’étape de configuration, une plage d’adresses IP est sondée par ping et le socle du mécanisme initial de supervision est configuré. Si la requête n’est pas menée à terme, vous en serez immédiatement avisé.
Test Ethernet
En entreprise, les postes de travail sont généralement connectés au réseau via des câbles Ethernet, ceux-ci offrant une stabilité supérieure à celle du wifi. De ce fait, nombreux sont les administrateurs qui se demandent si – et comment – ils peuvent superviser et tester les performances de leurs LAN. Des logiciels spécialisés permettent d’effectuer des tests Ethernet. PRTG est un outil de supervision réseau qui surveille aussi les réseaux locaux, notamment les réseaux distribués.
Plus d’informations sur la supervision LAN avec PRTG
Nous avons demandé : recommanderiez-vous PRTG?
Plus de 95 % de nos clients disent oui !
Paessler AG a mené des essais dans plus de 600 départements informatiques du monde
entier afin d'adapter son logiciel de surveillance réseau aux besoins des administrateurs.
Dans le cadre de l'étude, plus de 95 % des participants ont indiqué qu'ils recommanderaient volontiers PRTG ou l'avaient déjà fait.

Vous souhaitez en savoir plus ? Jetez un œil ici !

Améliorer les performances de Windows Server
PRTG utilise WMI, les compteurs de performances et SNMP pour la supervision de Windows. Il s’appuie également sur les éléments recueillis dans le journal d’événements et le Centre de Sécurité de Windows.
Performances des serveurs SQL
Avec PRTG, vous disposez d'un mécanisme complet de surveillance des bases de données. En effet, votre logiciel vous permet de surveiller tous vos logiciels SQL.
Performances des sites web
PRTG contrôle la disponibilité des sites web, les temps de chargement, et les processus – depuis n’importe où dans le monde.
Optimiser les performances des serveurs
Peu importe que vous ayez affaire à un serveur de bases de données, à un serveur de messagerie ou à un serveur web… en tant qu’administrateur, c’est à vous qu’il appartient de veiller au bon fonctionnement du réseau. Avec PRTG, vous gardez toujours à l’œil l’ensemble de vos serveurs et avez l’assurance d’être immédiatement alerté en cas de dysfonctionnement.
Capteurs de paquets
PRTG analyse les paquets de données et indique le taux de pertes de paquets de données. Quand un seuil critique est franchi, vous en êtes automatiquement avisé.
Supervision CDN
Avec PRTG, vous pouvez visualiser facilement la répartition du trafic entre les nœuds de diffusion de contenu internationaux, mais aussi obtenir des informations sur l’intensité du trafic, les temps de réponse et les éventuelles vulnérabilités à prendre en compte.
Gestion réseau
PRTG surveille en permanence vos réseaux, appareils, systèmes et applications. Cela vous aide à la gestion de votre réseau.
« Facile à mettre en œuvre et à configurer, avec une bonne assistance technique. »
R. v. S., ICT Manager chez Heinen & Hopman Eng BV
Toujours pas convaincu ?
![]()
Plus de 500 000 administrateurs système apprécient PRTG
Paessler PRTG est utilisé par des entreprises de toutes tailles. Les administrateurs systèmes apprécient PRTG parce qu'il simplifie leur travail.
Toujours pas convaincu ?
![]()
Supervisez l'intégralité de
votre infrastructure IT
Bande passante, serveurs, environnements virtuels, sites Internet, services VoIP – PRTG surveille l'ensemble de votre réseau.
![]()
Essayez Paessler PRTG gratuitement
Chaque utilisateur a des besoins de supervision différents. C'est pourquoi nous vous laissons essayer PRTG gratuitement. Démarrez maintenant un essai.
|
PRTG |
Logiciel de supervision réseau - Version 24.2.94.1400 (April 10th, 2024) |
|
Hébergement |
Téléchargement disponible pour Windows et en version hébergée PRTG Hosted Monitor |
Langues disponibles |
Anglais, Allemand, Espagnol, Français, Portugais, Néerlandais, Russe, Japonais, et Chinois Simplifié |
Prix |
Gratuit jusqu’à 100 capteurs (Liste de prix) |
Unified Monitoring |
Les périphériques réseau, la bande passante, les serveurs, les applications, les environnements virtuels, les systèmes à distance, l’IdO et bien plus |
Vendeurs et applications pris en charge |
|